Product
제품
-
Analytical Products
- Wyatt Technology
- Awareness Technology
- Eurofins l Abraxis (GSD)
- Aurora Biomed
- Canada NRC-CNRC
- Chrom Tech
- Eichrom Technologies
- EPROGEN
- Fluidic Analytics
- Globe Scientific
- GENERON
- Halo Labs
- Hygiena International
- KROMATON
- InProcess-LSP
- MTC Bio
- MZ-Analysentechnik
- Newomics Inc.
- Occhio Instruments
- Optimize Technologies
- Pickering Laboratories
- PolyLC
- Raykol Group
- RheoSense
- Rocker Scientific
- Santai Science
- SEDERE
- Spectra Analysis
- UCT
- Wealtec Corp
-
Bio & Medical Products
- Biolog
- Adooq Bioscience
- A&A Biotechnology
- Accegen Biotechnology
- Anatrace
- Array Bridge
- Biogenes GmbH
- BioQuochem
- BioServ UK
- Biomiga
- Biotech Support Group
- CinderBio
- Cell Technology
- Creative Biolabs
- Creative Diagnostics
- Creative Biostructure
- Creative Biomart
- Creative Enzymes
- EICOM
- Emulseo
- GLYcoDiag
- Helix Biotech
- InnoGenomics
- IsoSciences, LLC
- IUL Instruments
- Micropore Technologies
- Matrix Innovation
- PreciGenome
- PhylumTech
- ProFoldin
- Protein Ark
- Primer Design
- ProteoChem
- RareCyte
- RECIPE
- Silicycle Inc.
- Tymora Analytical
- UTAK
- YouSeq
- Z Biotech
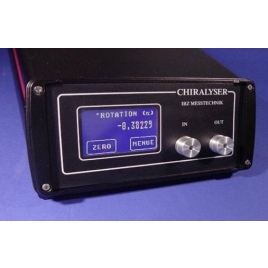
- CHIRALYSER-MP
- 제품명: CHIRALYSER-MP
- 용도: Chiral Detector
- 메이커: IBZ Messtechnik
- 카달로그:

소개
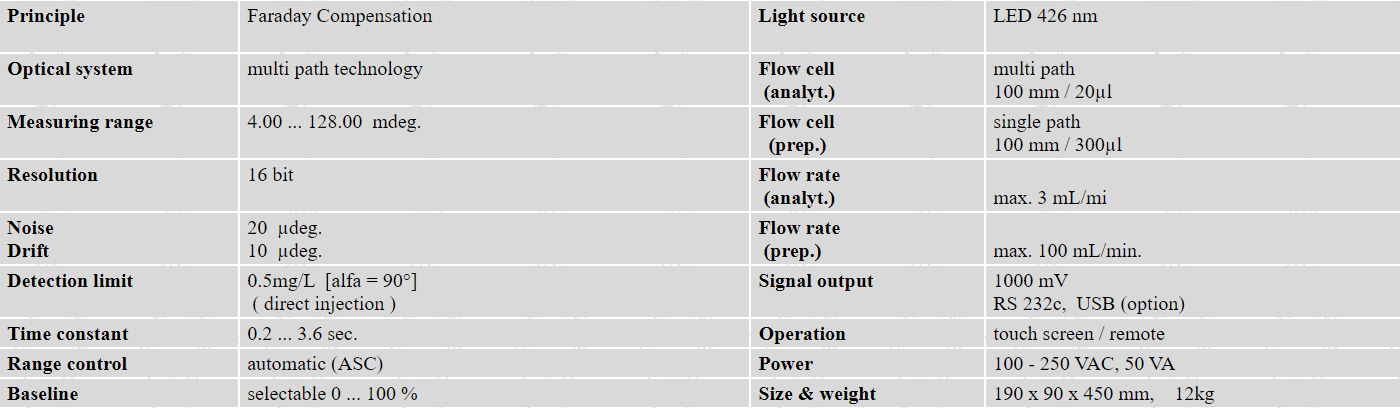
CHIRALYSER-MP
Novel Chiral Detectorwith multi path cell for enhanced sensitivity
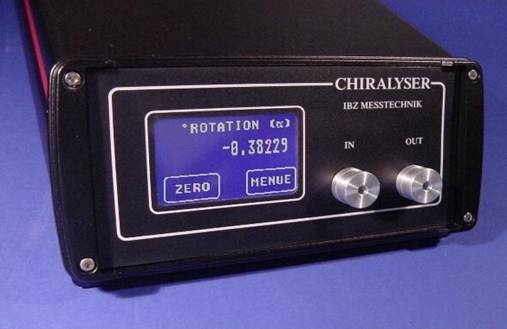
The CHIRALYSER-MP is a high performance Optical Rotation Detector for monitoring Optically Active compounds in HPLC. Innovative flow cell design in multi path technology together withan optimized measuring wavelength performs outstanding sensitivityand excellent signal to noise ratio.
The approved Faraday Compensation, superior to all other methods,ennablesthe CHIRALYSER-MP to detect optical active moleculesnot only in analytical but also in preparative LC. Operation via touch screen or remote controlled by host computeradapts the CHIRALYSER-MP to any chromatography system.
OPTIMAL CHIRAL DETECTION:THE WAVELENGTH RELATIONSHIP
Abstract
There is a practical range for the detection of chiral compounds by polarimetry, extending between the diminishing returns predicted by Drude’s Equation and possibly substantial deviations seen at lower detector wavelengths, some so extreme that a change in polarity is observed. A blue LED provides a light source at the center of this range, and is the basis for a modified polarimetric detector having improved sensitivity to a wider range of compounds.
This poster describes the performance of the latest iteration of the CHIRALYSER Polarimetric Detector, which incorporates such an "optimized wavelength" blue LED as its light source. Examples of chromatography showing information-distorting effects of too-low wavelengths (including polarity switching) as well as sensitivity improvements seen as a result of lowering too-high wavelengths toward the optimal one are presented.
The dependence of rotational strength of optically active molecules on the wavelength of light used for measurements is described by "Optical Rotation Dispersion", or "ORD". This property is specific to each chiral molecule and differs in intensity. In general, however, it shows greater rotational strength for shorter wavelength light in the so calledPlain Curve. The Plain Curve is a graphic depiction of Drude´s equation, which describes the normal behaviour of ORD in absence of chromophores or otherwise far away from an absorbtion band.
Drude´s Equation : [a]l = S Ai / (l2 -l i )
(Ai constant molecular characteristic)
(li constant wavelength)
Within or close to a strong absorbtion band, the Plain Curve may become abnormal and no longer obey Drude´s equation. Such regions of abnormality are said to display Cotton Effects, in extreme cases causing an apparent change in the polarity of a measured species.
Both situations -- the predictions for the effect of wavelength on signal strength (i.e., the Plain Curve of Drude's Equation) and the deviations from the Plain Curve caused by Cotton effects -- are represented by the blue and red curves in Figure 1.
R-(-) Camphorquinone and (+) Methyltestosterone were chosen as models to demonstrate both Drude's Equation and deviations from it due to Cotton effects.
Figure 2 shows four sets of chromatograms, each run at a different wavelength, which have been arranged along the x-axis so that the wavelengths are approximately linear. Settings other than wavelength were the same (baseline variations are characteristic of the wavelengths used). Note that the measurements are taken using the CHIRALYSER polarimetric detector, which uses a Faraday Compensation electronics scheme; signal strength is therefore not related to light amplitude (and different light sources may therefore be used for demonstration purposes).
From a comparison of the chromatographic traces of Figure 2 and the curves of Figure 1, one can see a correlation to the Plain Curve for the three higher wavelengths (i.e., for 430, 520 and 589 nm). The chromatogram at 370 nm, on the other hand, shows deviations from the Plain Curve: that for (+) Methyltestosterone shows a lessened signal strength; that for (1R)-(-)-Camphorquinone shows an even greater aberration: an apparent switch in polarity.
A relatively small percentage of unknown samples may display such extreme Cotton effect behavior. On the other hand, the fact that some do suggests that a light source should have a wavelength that is comfortably away from strong absorbance bands. A proposed range for source wavelengths that balances the risk from Cotton effects with the desirability for increased signal strength is 400 - 460 nm, as shown by the shaded area of Figure 1.
Summary:
1. As a general rule (Drude's Equation), signal strength from measurements of optical rotation increases as the wavelength of the light used is decreased.
2. Cotton effects, caused by strong absorbance bands near the wavelengths used to measure the rotation strength of chiral samples, can influence signal strength and,
in some cases,the observed polarity.
3. A range of wavelengths, balancing the desirability for maximum signal strength and the undesirability of experiencing possible Cotton effects is proposed as 400-460 nm.
4. A "blue" LED, producing light with a mean wavelength of 430 nm, is at the center of this range and represents a state-of-the-art light source for polarimetric detectors.
Conclusion:
With the advent of an LED having a mean wavelength of 430 nm the center of the optimal range for detection and avoidance of Cotton Effects -- chiral chromatography hasfound an optimal light source.
Why not a laser?
A polarimetric detector can use any light source, e.g., a laser, a lamp (incandescent or ionizing) or an LED.
A laser may have problems of beam alignment in commercial machines: birefringence effects at the opening of the flow cell, as well as problematic alignment down the cell can produce undesirable effects. A lamp is subject to fluctuations; it is relatively noisy. An LED, on the other hand, presents the ideal light source for polarimetric detectors. Since an LED produces some (small) bandwidth of frequencies, birefringence effects from light passing by flow cell window edges or extinction effects from its contacts with cell wall surfaces are not a problem. Further, fluctuations in light from an LED are minimal. An LED has the added virtues of being rugged and extremely long lasting.
Introduction to Polarimetric Detectors
A Polarimetric Detector (a.k.a. "Optical Rotation Detector", "ORD", "[polarimetric] Chiral Detector") is a useful instrument for detecting and measuring chiral molecules in HPLC. Solutions of such molecules have the property of rotating plane-polarized light in a preferred direction and to a specific degree. This property is specific to each chiral molecule, and is what is measured by the detector.
Information from a polarimetric detector yields two "bits" of information about a chiral sample: its direction of rotation -- denoted by signals above the baseline for "positive" rotators and below for "negative" rotators -- and its signal strength.
The display of data from a polarimetric detector resembles that from a refractive index detector, in that it shows signals both above and below a baseline. Unlike that from the refractive index detector, however, signal output from the polarimetric detector uses an "absolute" baseline rather than a comparative one. The above and below-the-baseline signals of the polarimetric detector represent "real", as opposed to relative information.
The "two-bit" information generated by the Polarimetric Detector leads to a number of useful applications.
FIGURE 1: EFFECT OF LIGHT SOURCE WAVELENGTHON SIGNAL STRENGTH: THE PLAIN CURVEAND DEVIATIONS FROM COTTON EFFECTS
According to Drude’s Equation, plane-polarized light of decreasing wavelength will produce a stronger rotational response in chiral samples. This is represented by the so-called"Plain Curve" (blue line). However, at wavelengths lower than ~ 400 nm, deviations from this prediction may be seen for some percentage of samples, some extreme. Thesedeviations are represented by the red line – with the changes shown meant to mean "anything can happen"
Figure 2. CHIRAL SPECIES THAT DEMONSTRATE BOTHCONFORMANCE TO THE "PLAIN CURVE" ANDCOTTON EFFECTS AT VARIOUS WAVELENGTHS
At light source wavelengths lower than 400 nm, sometimes dramatic deviations from the Plain Curve may be seen. In the above series – where chromatograms at varied light source wavelengths have been arranged along the x-axis in approximate linearity -- (1R)-(-) Camphorquinone (peaks outlined in yellow) has apparently changed its polarity atthe 370 nm wavelength.
Figure 3: CHIRALYSER Performance Difference using 430 nm LEDThe "quieter" and lower wavelength (430 nm) LED light source has increased the sensitivity of the latest generation CHIRALYSER markedly. All settings for these reference standards are the same, although other improvements (sampling rate; automatic optimization of the optical bench) have also contributed to the overall performance.
사양
관련자료
|
Applications
|
|---|
|
1. (+)-1-Phenyl-1-propanol (-)-1-Phenyl-1-Propanol, various e:e |
| 11. Chiral Detectors (various),comparative test |