Libraries
라이브러리
발표문헌
제품이 사용된 발표 문헌이 정리되어 있습니다. home
home- > 라이브러리 >
- 발표문헌
|
[PM] Cell Modeling and Computational Analysis of Biolog PM Data
인성크로마텍(주)
|
| Date : 2020.02.11 |
| 분류 : Bio & Medical Products > Biolog |
Cell Modeling and Computational Analysis of Biolog PM Data
Many research groups are interested in cell modeling, and models have begun to gain acceptance and proliferate. But are these models accurate and capable of making useful predictions of cell function? The last several years have seen significant improvements in computational methods for performing phenotypic predictions from metabolic network models. The speed with which such models can be assembled has also advanced. Similarly, experimental methods for high-throughput phenotypic characterization of cells have advanced during this time, and in particular, the use of Phenotype MicroArrays in challenging and improving models has become more widespread. A three-day conference will bring together researchers in these and related areas to define current gaps and explore potential synergies between these computational and experimental approaches. Biolog customers have developed software systems and computational methods for the storage, display, and statistical analysis of Biolog Phenotype MicroArray data. This newsletter provides a brief description of storage/display software, published methods for analyzing PM data, and examples of biological discovery. EcoCyc: Fusing Model Organism Databases With Systems Biology Peter Karp and colleagues present an updated model organism database integrating genome sequence, experimental literature, and Phenotype MicroArrays. Using new tools, the impact of EcoCyc knowledge is demonstrated.
The DSMZ authors were motivated to extract as much information as possible from the high throughput phenotyping provided by Biolog Phenotype MicroArrays. They hypothesized that multiple kinetic parameter estimation is necessary to capture the diversity of the biological response recorded over time. Therefore they adapted R functions and existing statistical methods for modeling kinetic curves into a package that is customized to work within the biological context of Biolog PM kinetic redox dye reduction curves.
New statistical methods are proposed for the analysis of PM data. Distance is quantified between mean and median curves followed by a permutation test. A second approach involved a permutation test on mean area under the curve. These methods were applied to both synthetic and real data. Genome-scale metabolic models were created and validated against Biolog data where available. Biolog data facilitated genome annotation by showing positive unpredicted reactions that were due to poorly annotated transporters. Biolog validation significantly improved metabolic models in all cases.
OmniLog Phenotypic MicroArray Data PheMaDB is a web-based relational database management system that is standardized for OmniLog phenotypic microarrays (PM) data. It is used to store, visualize, and analyze large collections of time-series PM data for bio-pathogens. PheMaDB includes seven analytical modules: outlier analysis, negative control analysis, phenotype barplot, correlation matrix, phenotype profile search, k-means clustering, and heatmap analysis. The system was developed by the US Naval Medical Research Center and the MITRE Corporation.
Visualization of Growth Curve Data from Phenotype MicroArray Experiments
LBNL developed software to produce and display color images representing growth curve data. Using pseuodocolor, the authors have turned the kinetic OmniLog response into a linear graphic called a PMColorMap. This software was used to compare replicates and identify phenotypic differences.
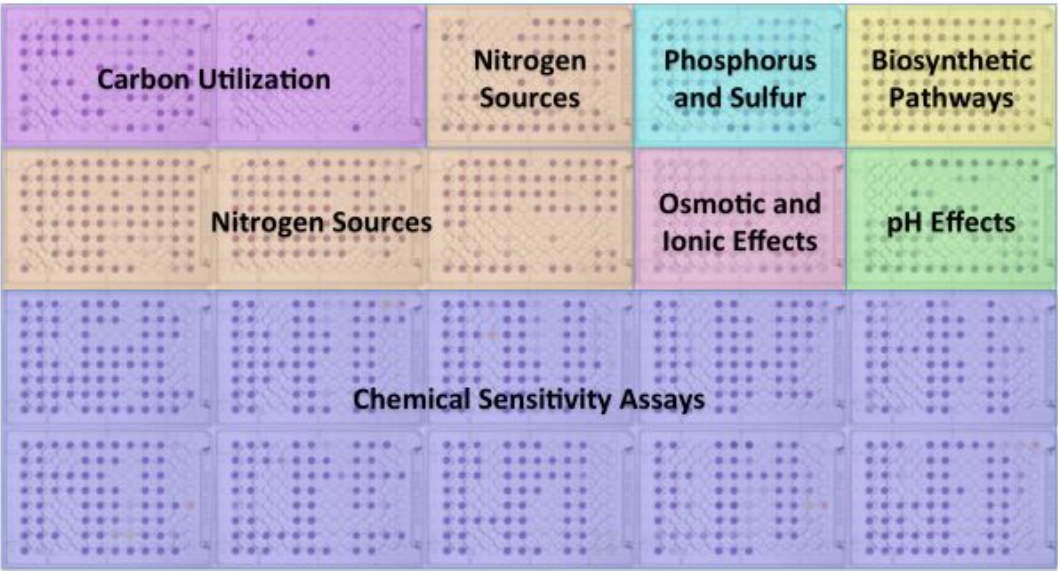
Phenotype MicroArray Technology
Biolog’s Phentoype MicroArray technology enables researchers to evaluate nearly 2000 phenotypes of a microbial cell in a single experiment. This integrated system of cellular assays, instrumentation and bioinformatics software provides cellular knowledge that complements molecular information, helping you interpret and find the relevant aspects in massive amounts of gene expression or proteomics data. Through comprehensive and precise quantitation of phenotypes, researchers are able to obtain an unbiased perspective of the effect on cells of genetic differences, environmental change, exposure to chemicals or drugs, and more. |