Solutions
솔루션
Phenotype MicroArray™
한번의 실험으로 수백여 개의 세포적 피노타입(Cellular Phenotypes) 정성/정량 분석 home
home- > 솔루션 >
- Phenotype MicroArray™
|
[PM-M] 세포 / 암세포 대사 연구
인성크로마텍(주)
|
| Date : 2020.01.14 |
| 분류 : 포유류세포 |
The Phenotype MicroArray Assay Technology For Cell and Cancer Cell Metabolism Research
PM technology consists of 96-well microplates with pre-arrayed sets of 96 different tests and a companion instrument called the OmniLog™ which incubates and monitors the response of the live cells over a time course of hours to days.
Background on PM Technology
Biolog has developed proprietary redox dye chemistries that allow real time measurement of the flux of energy production (reduction of NAD to NADH) by cells. As cells produce NADH in various assay wells, they simultaneously reduce a redox dye forming increasing levels of purple color that is measured and recorded by the OmniLog instrument. The amount of purple color reflects the amount of energy the cells are producing. This extremely simple, sensitive, and reproducible assay can then be coupled to the measurement of thousands of diverse cellular pathways in many important areas of scientific research.
OmniLog-PM’s Assay Portfolio for Mammalian Cells Includes the Following:
• Carbon Energy and Nitrogen Substrates : 4X96-well plates, using 367 metabolic substrates, one substrate per well, and each linked to a separate metabolic pathway. The pre-arrayed substrates include carbohydrates/starches, alcohols, fatty acids, ketones, carboxylic acids, amino acids and bi-amino acids • Hormones : 3X96 well plates, 45 different pre-arrayed hormones at six different concentrations each • Trace Elements : 1X96-well plate with 22 different pre-arrayed ions/cofactors at four different concentrations each • Anti-Cancer Chemosensitivity : 4X96-well plates with 92 pre-arrayed and well-established anti-cancer chemical agents at four different concentrations each • Mitochondrial Toxicity : 1X96-well plate with 8 diverse carbon-energy substrates (associated with diverse pathways, e.g. hexose,pentose, etc.) to distinguish different aspects of mitochondrial activity/dysregulation in the context of chemical/drug screens
Researchers can purchase individual assay plates from this portfolio according to their specific research requirements. In addition, the specific composition of the substrates and metabolic effectors used in the PMM assays, as well as standard protocols, can be found on the Biolog website. There is also an even more extensive set of OmniLog-PM assays available for bacterial and fungal cells,which too can be found on the website.
Metabolic and other Phenotypic Characterization of Cells
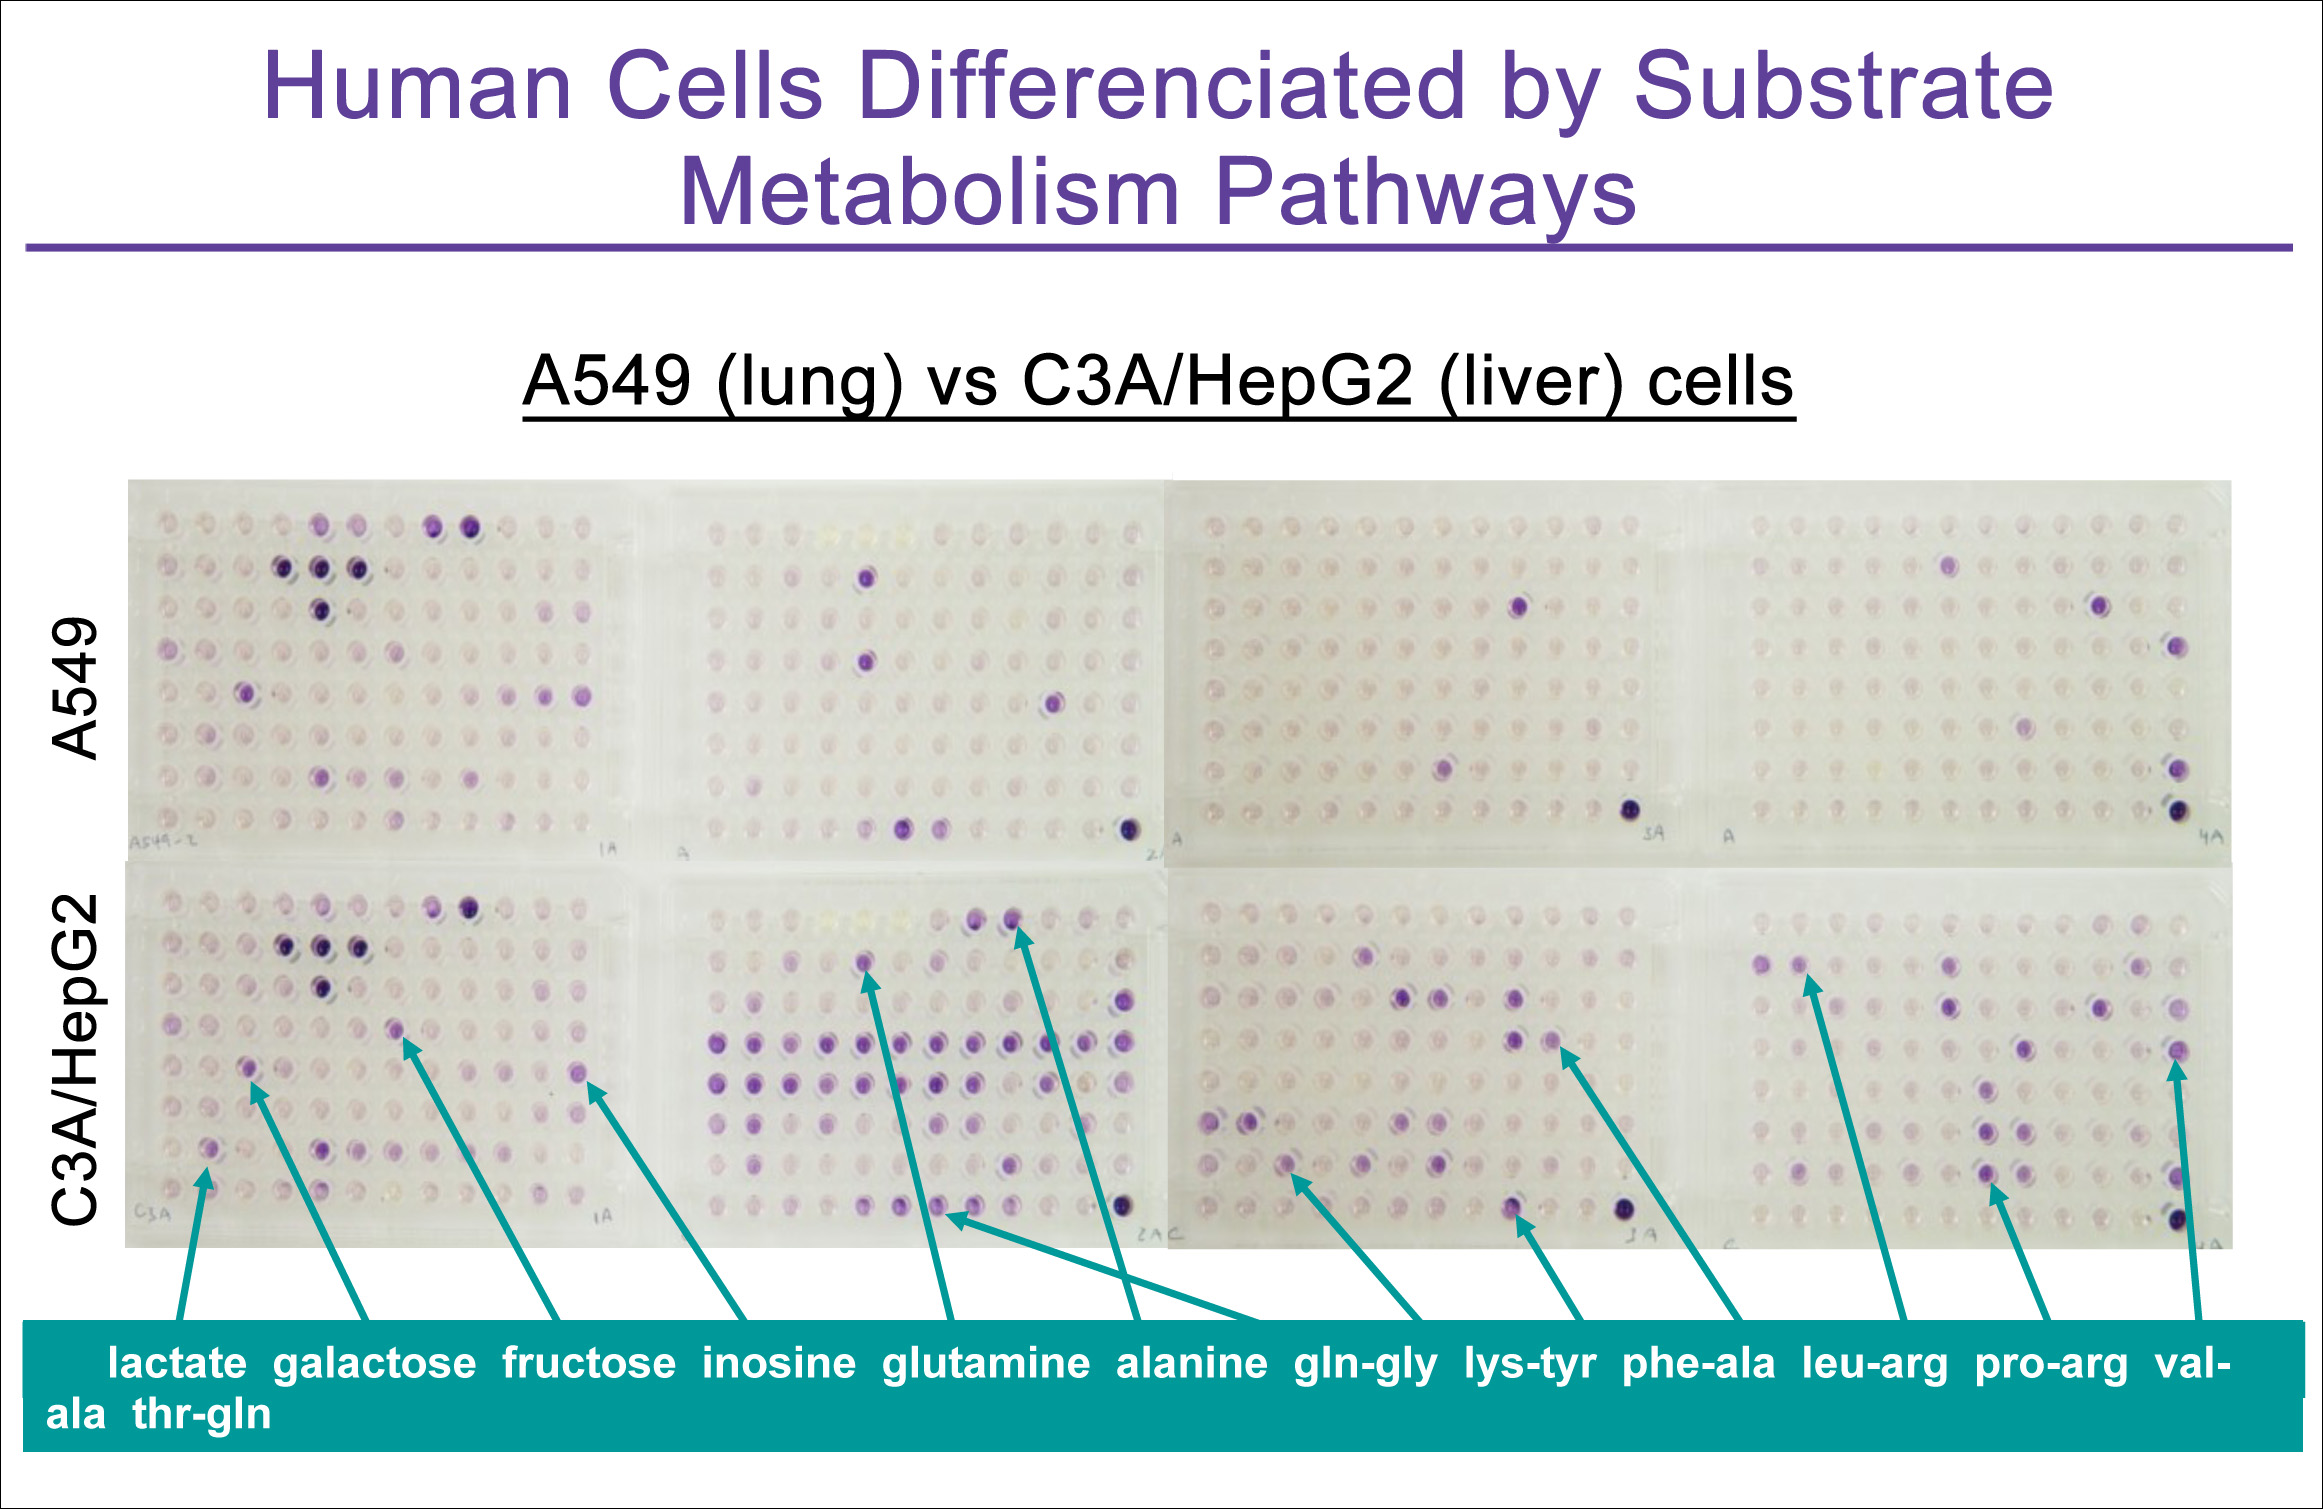
PM panels PM-M1, M2, M3, and M4 contain 367 different carbon-energy sources and provide the capability to examine the rate of energy production via metabolism of diverse mono- and polysaccharides, alcohols, carboxylic acids, ketones, fatty acids, amino acids and peptides. As shown in Figure 1, mammalian cells are typically capable of metabolizing not only glucose (PM-M1 wells B4, B5, B6) and mannose (well C5) but also many other biochemical substrates. Each cell type differs in the scope and rate of metabolism of these 367 substrates, providing a simple and informative metabolic characterization that reflects the biochemistryof the organ from which the cell line was derived. Hence the liver-derived cancer cell shown in the Figure is much more metabolicallyactive than the lung-derived cancer cell.
Figure 1
Genotype/Phenotype Studies in Cancer and other Applications
PMM assays can be used to determine the phenotypic changes that occur as a consequence of a genetic alteration, providing a direct phenomic determination of gene function.
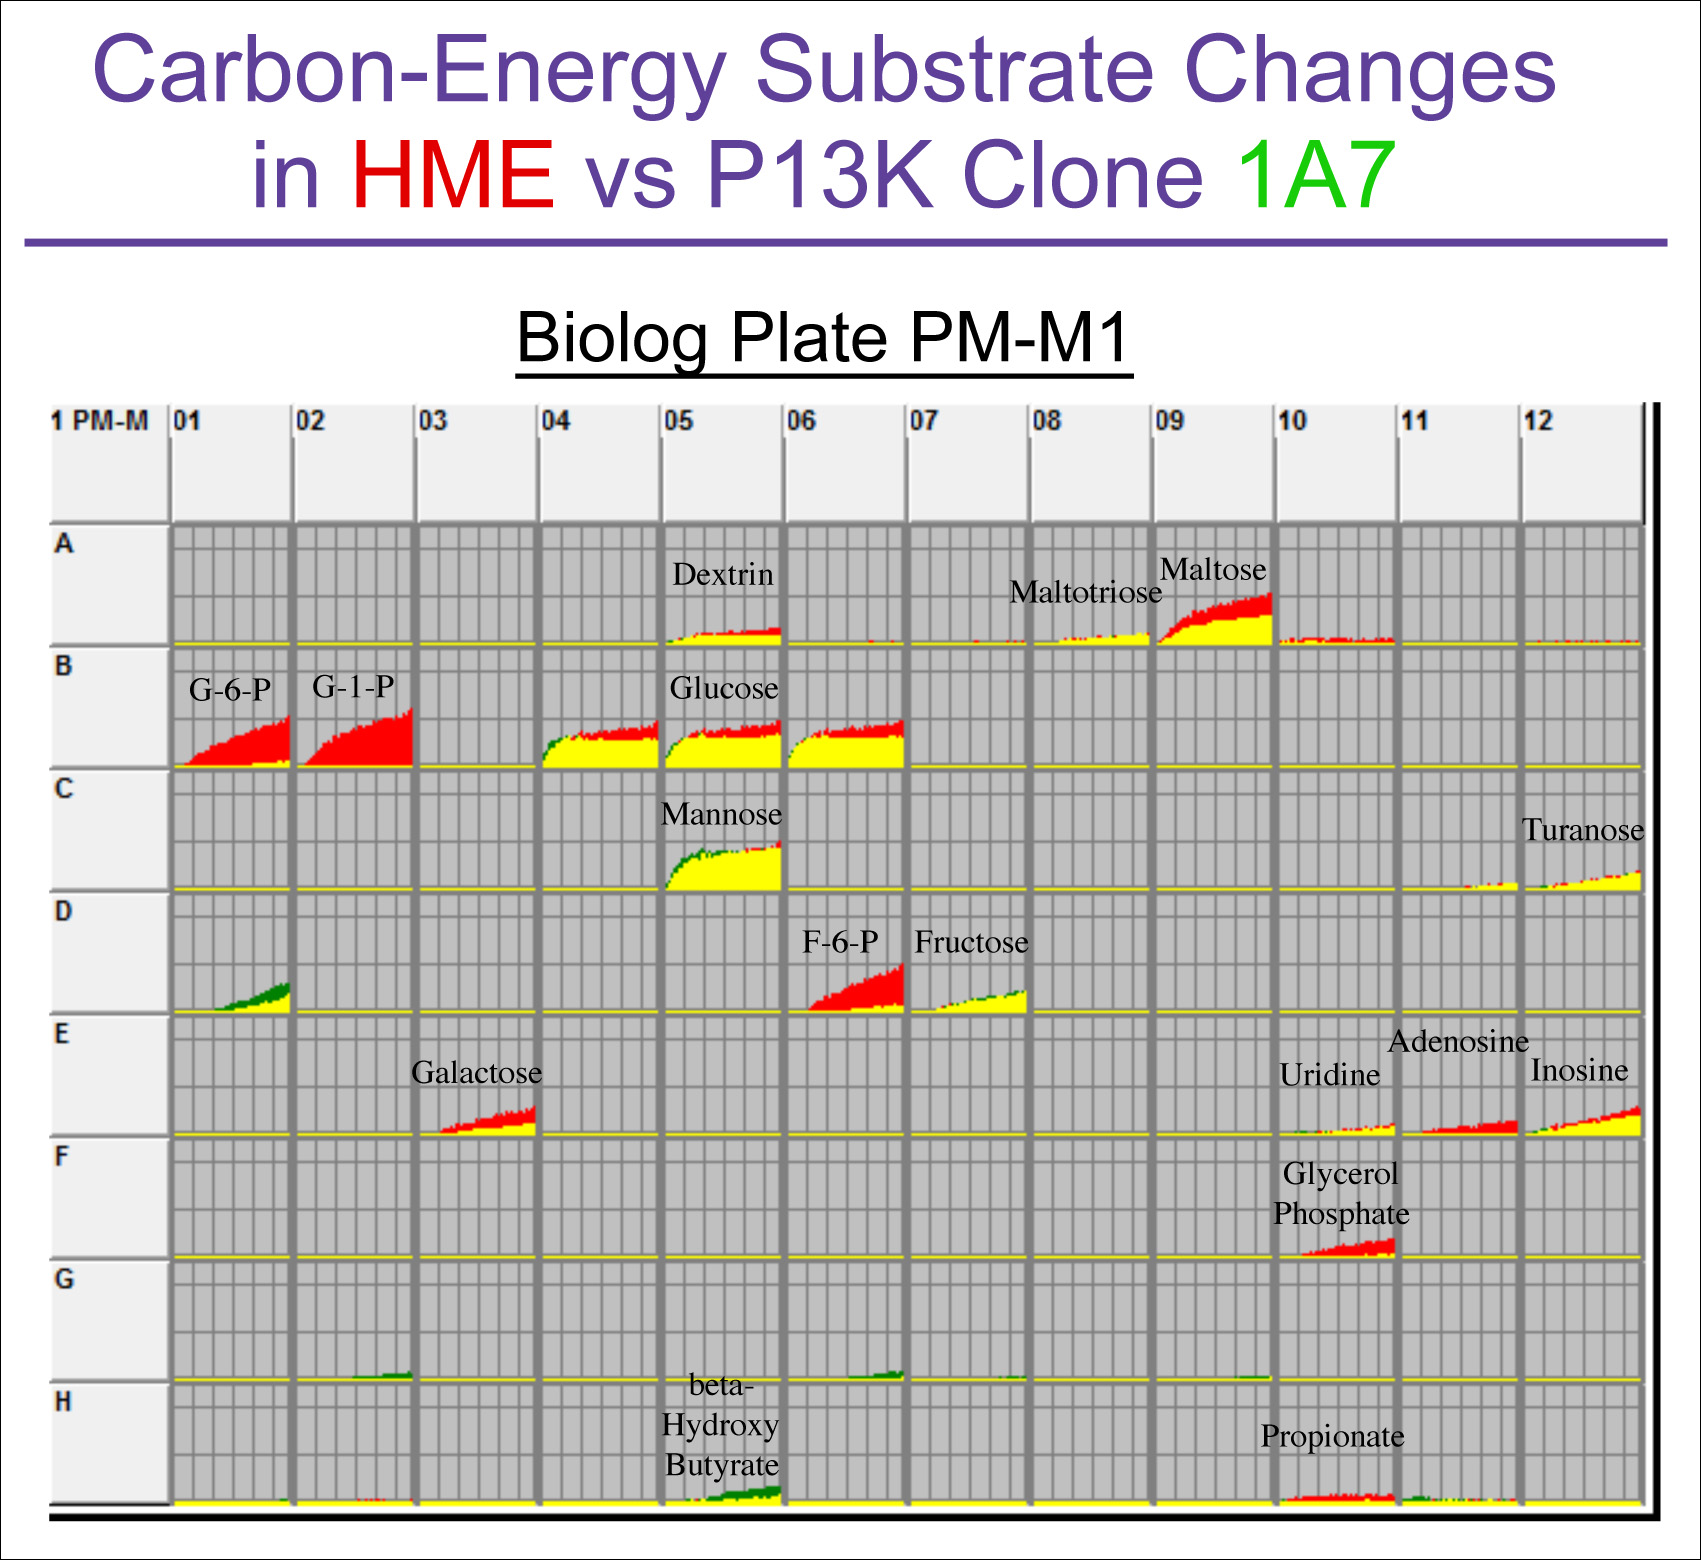
A major current interest in cancer research is to understand the Warburg effect (elevated rate of aerobic glycolysis and lactic acid production) and its relationship to oncogenic mutations. Figure 2 shows an analysis of the energy metabolic pathway changes comparing a human mammary epithelial (HME) cell to a mutant line engineered with a PI3K mutation common in breast cancer (clone 1A7 created by Horizon Discovery, Cambridge, UK). The PM analysis clearly shows an unanticipated result: a strong decreasein the metabolic rate of phosphorylated sugars.
Figure 2
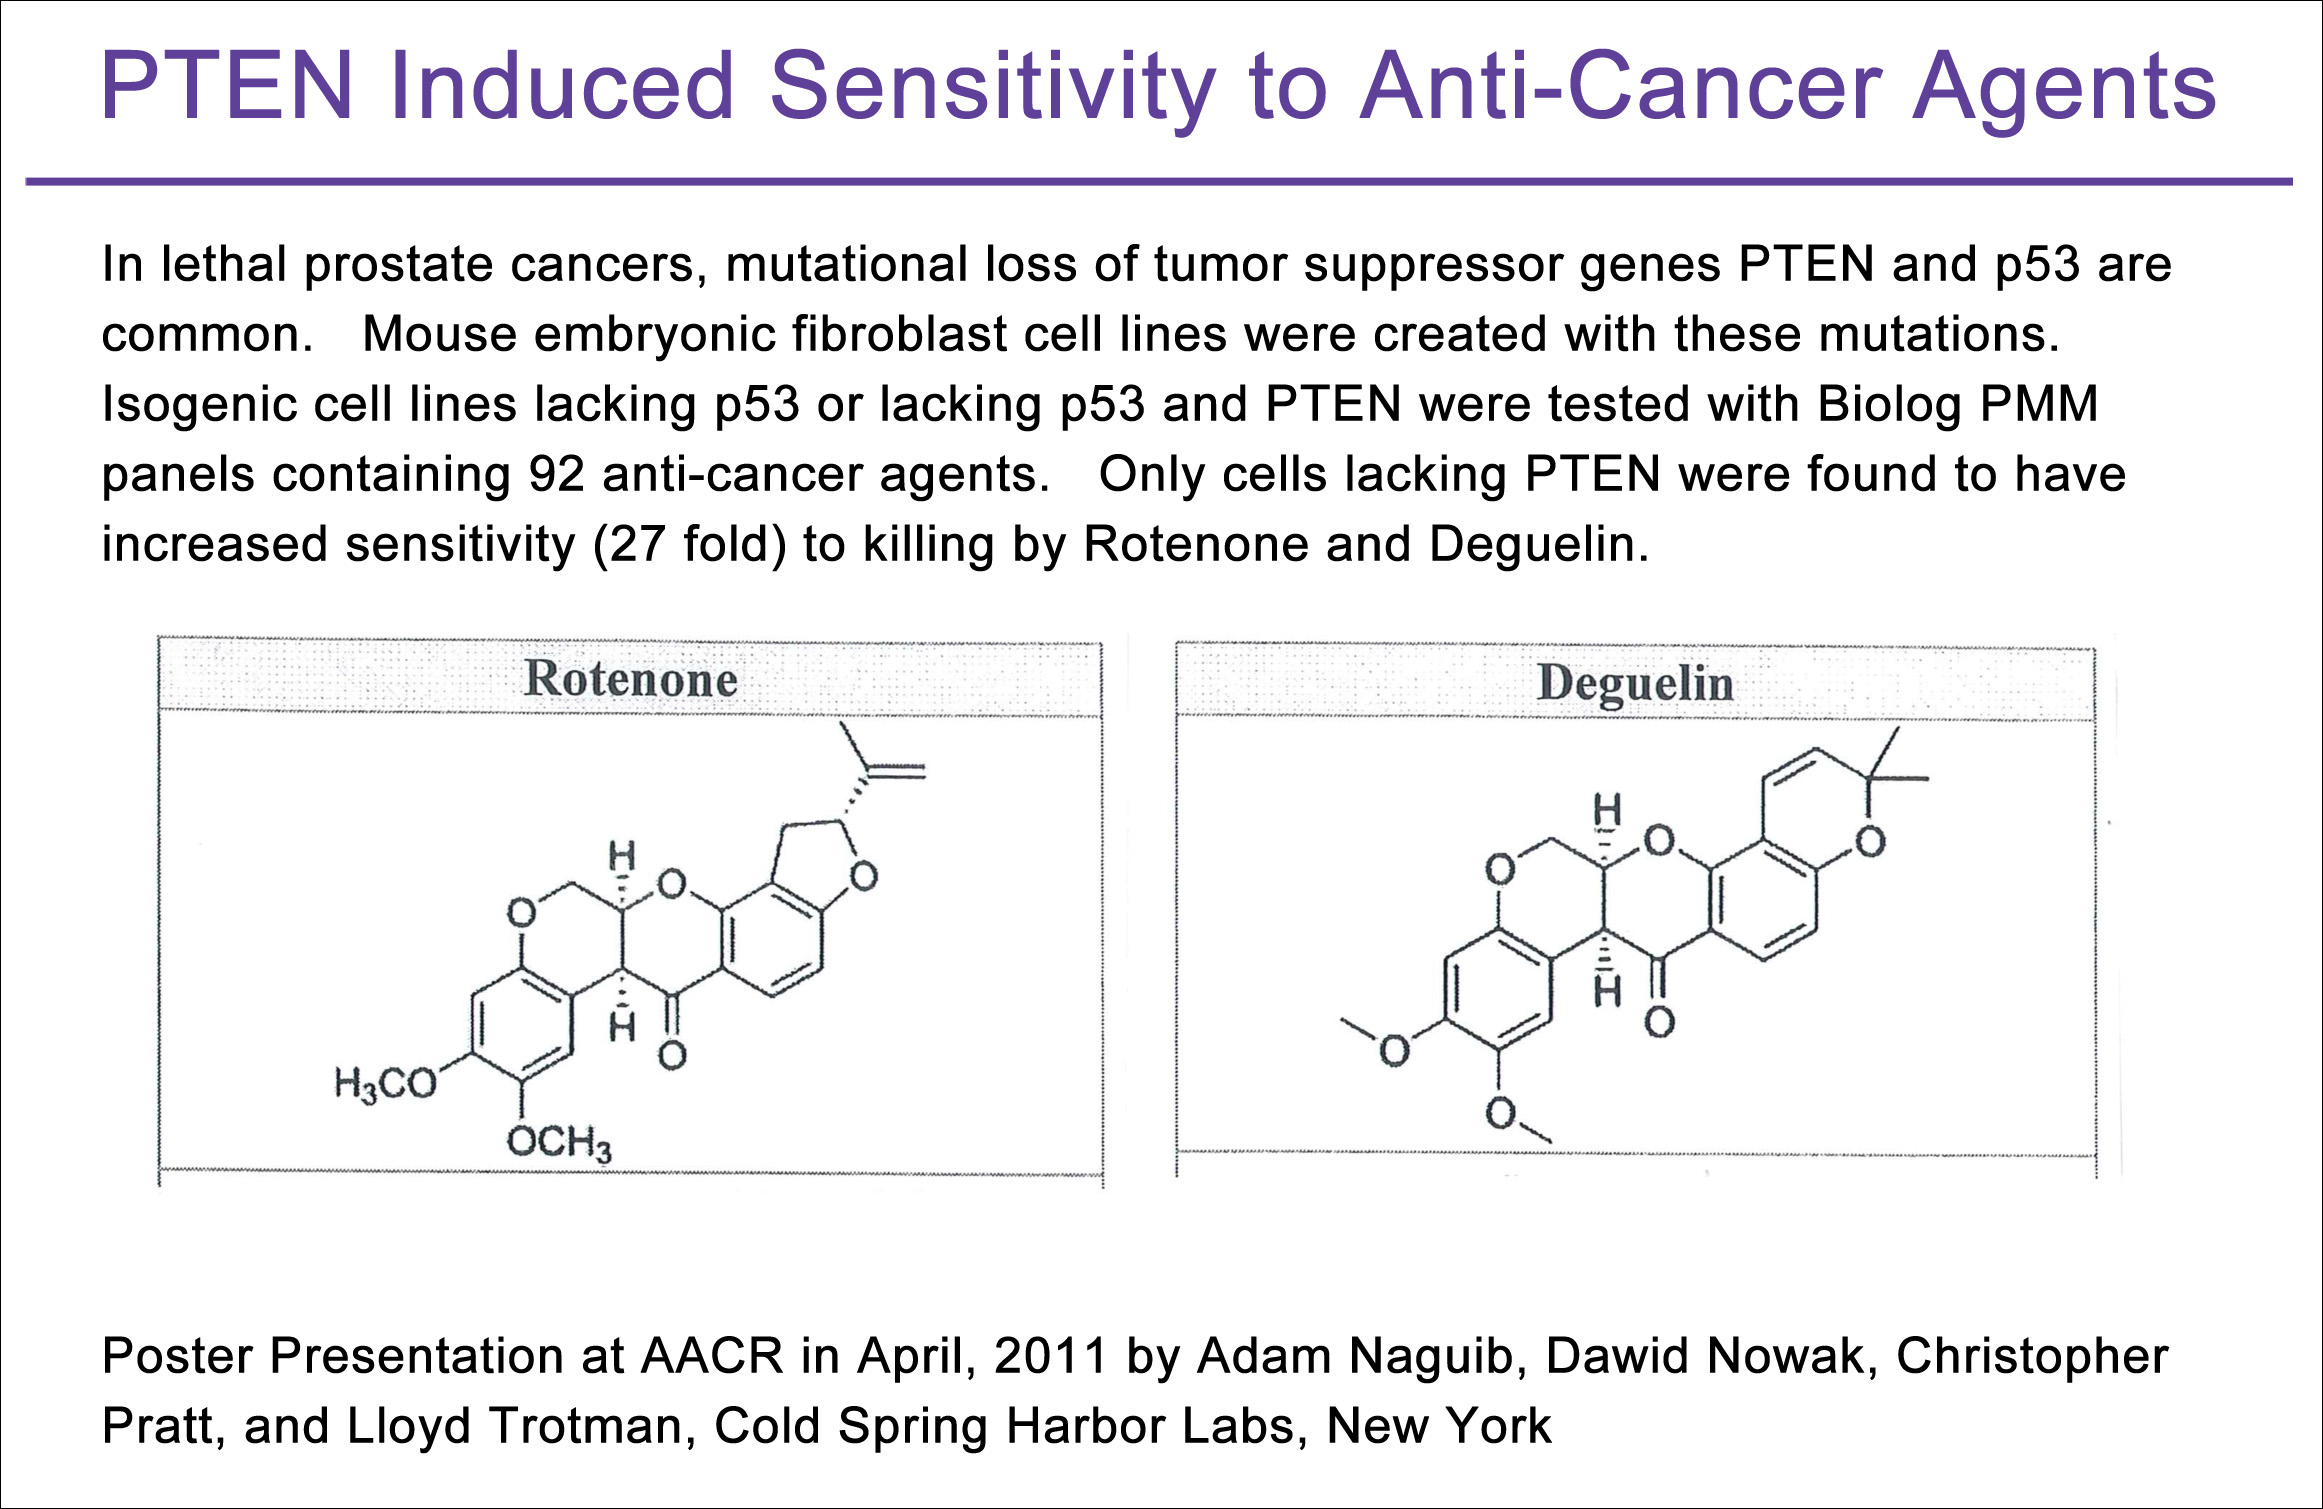
As another illustration, the laboratory of Dr. Lloyd Trotman (Cold Spring Harbor Labs, NY) examined the phenotypic consequences of p53 and PTEN mutations important in prostate cancer. Using isogenic mouse cell lines that they created, they assayed for phenotypic changes to anti-cancer agent sensitivity with PMM panels (PM-M11, M12, M13, and M14). In their presentation at the 2011 AACR Meeting they reported that p53 mutant cell lines lacking PTEN exhibited dramatically increased sensitivity (27 fold) to two structurally similar anti-cancer agents, rotenone and deguelin (Figure 3).
Figure 3
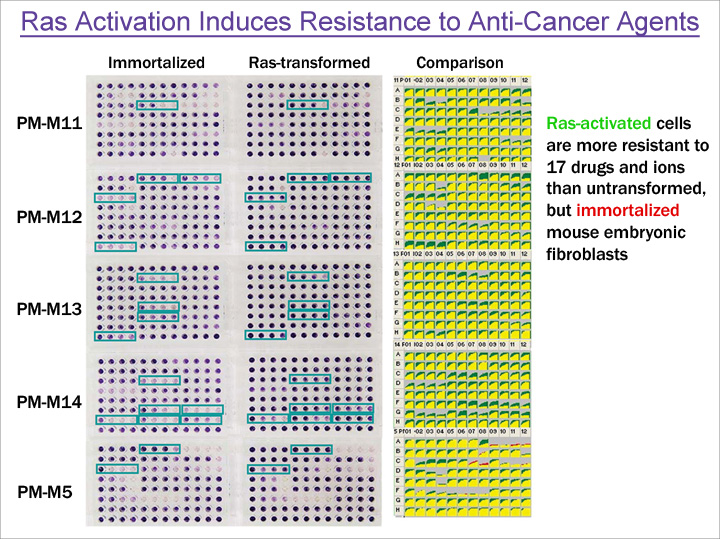
A second example of altered sensitivity to anti-cancer agents is shown in Figure 4. In this example the mouse embryonic fibroblast cells engineered to contain an activated RAS gene showed increased resistance to 17 toxic chemicals.
Figure 4
New Metabolic Approach to Cancer Cell Research from Biolog on Vimeo.
|